XC Scenario User Guide
Table of Contents
Introduction
This document is meant to be a comprehensive guide to Invivoo’s XC Scenario product, from an end user’s point of view. As such, it describes the user interfaces for designing, editing, running, and monitoring scenarios.
The general concepts of Scenario are described in the Scenario Concepts Guide. If you are not familiar with the notions of scenarios/workflows, tasks, etc, we recommend that you read that guide first, and then come back to this one.
Software Version
This document corresponds to version 16.5 of the Scenario software. To check what version of the software you’re using, click on the X4B account icon on the right of the X4B banner, at the top of your screen.

General Overview
Introduction
This document gives a full and comprehensive description of the Scenario UI (User Interface) and its usage.
The Scenario user interface is a web application, or so-called thin client. It requires no installation on the user’s computer, and can be accessed with a simple web browser, by pointing it to the URL of Scenario. The exact URL to use is dependent on the installation and setup that was done in your company, by your IT staff. If you don’t know this URL, please contact your IT administrator.
Main sections
The web application has several pages, which can be accessed from the menu panel on the left of each web page, by clicking on the page title :
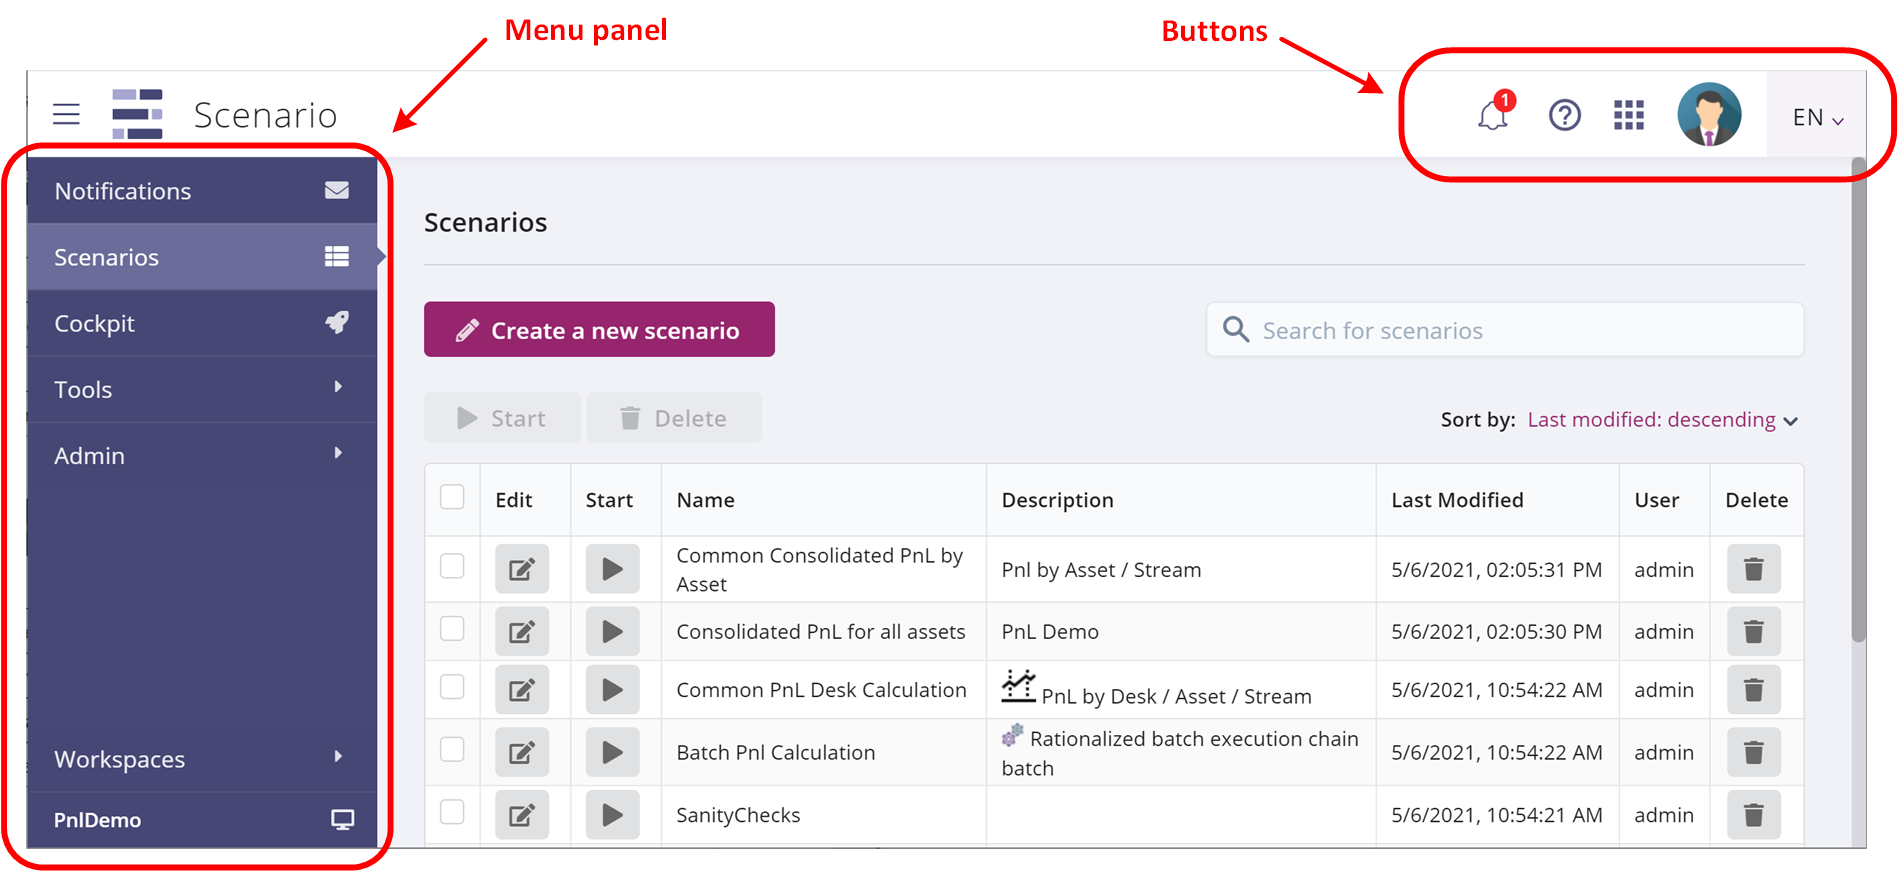
Contents of each page (detailed in the following sections):
- Notifications: view the list of pending notifications from manual tasks
- Scenarios: view the list of existing scenarios, edit a scenario, launch a scenario run
- Cockpit: real-time view of running scenarios and tasks
- Tools: API token generation, scenario and task catalog import/export
- Admin: manage users, roles, rights, etc. Restricted to administrative users.
- Workspaces: dropdown menu allowing a user to choose which workspace to work in.
Also present to the right of the top-level ribbon are a few buttons:
| Icon | Description |
|---|---|
| Link to manual tasks’ Notifications page. | |
| Links for help and support, email and Slack channel. | |
| Links to other X4B applications, such as AppControl and Chatbot Fabric. | |
| Currently logged-in user account information, and software version. | |
| Choice of UI language, currently English and French are supported. |
Logging into the system
When you type in the Scenario address in your browser, you are brought to the application’s login prompt :
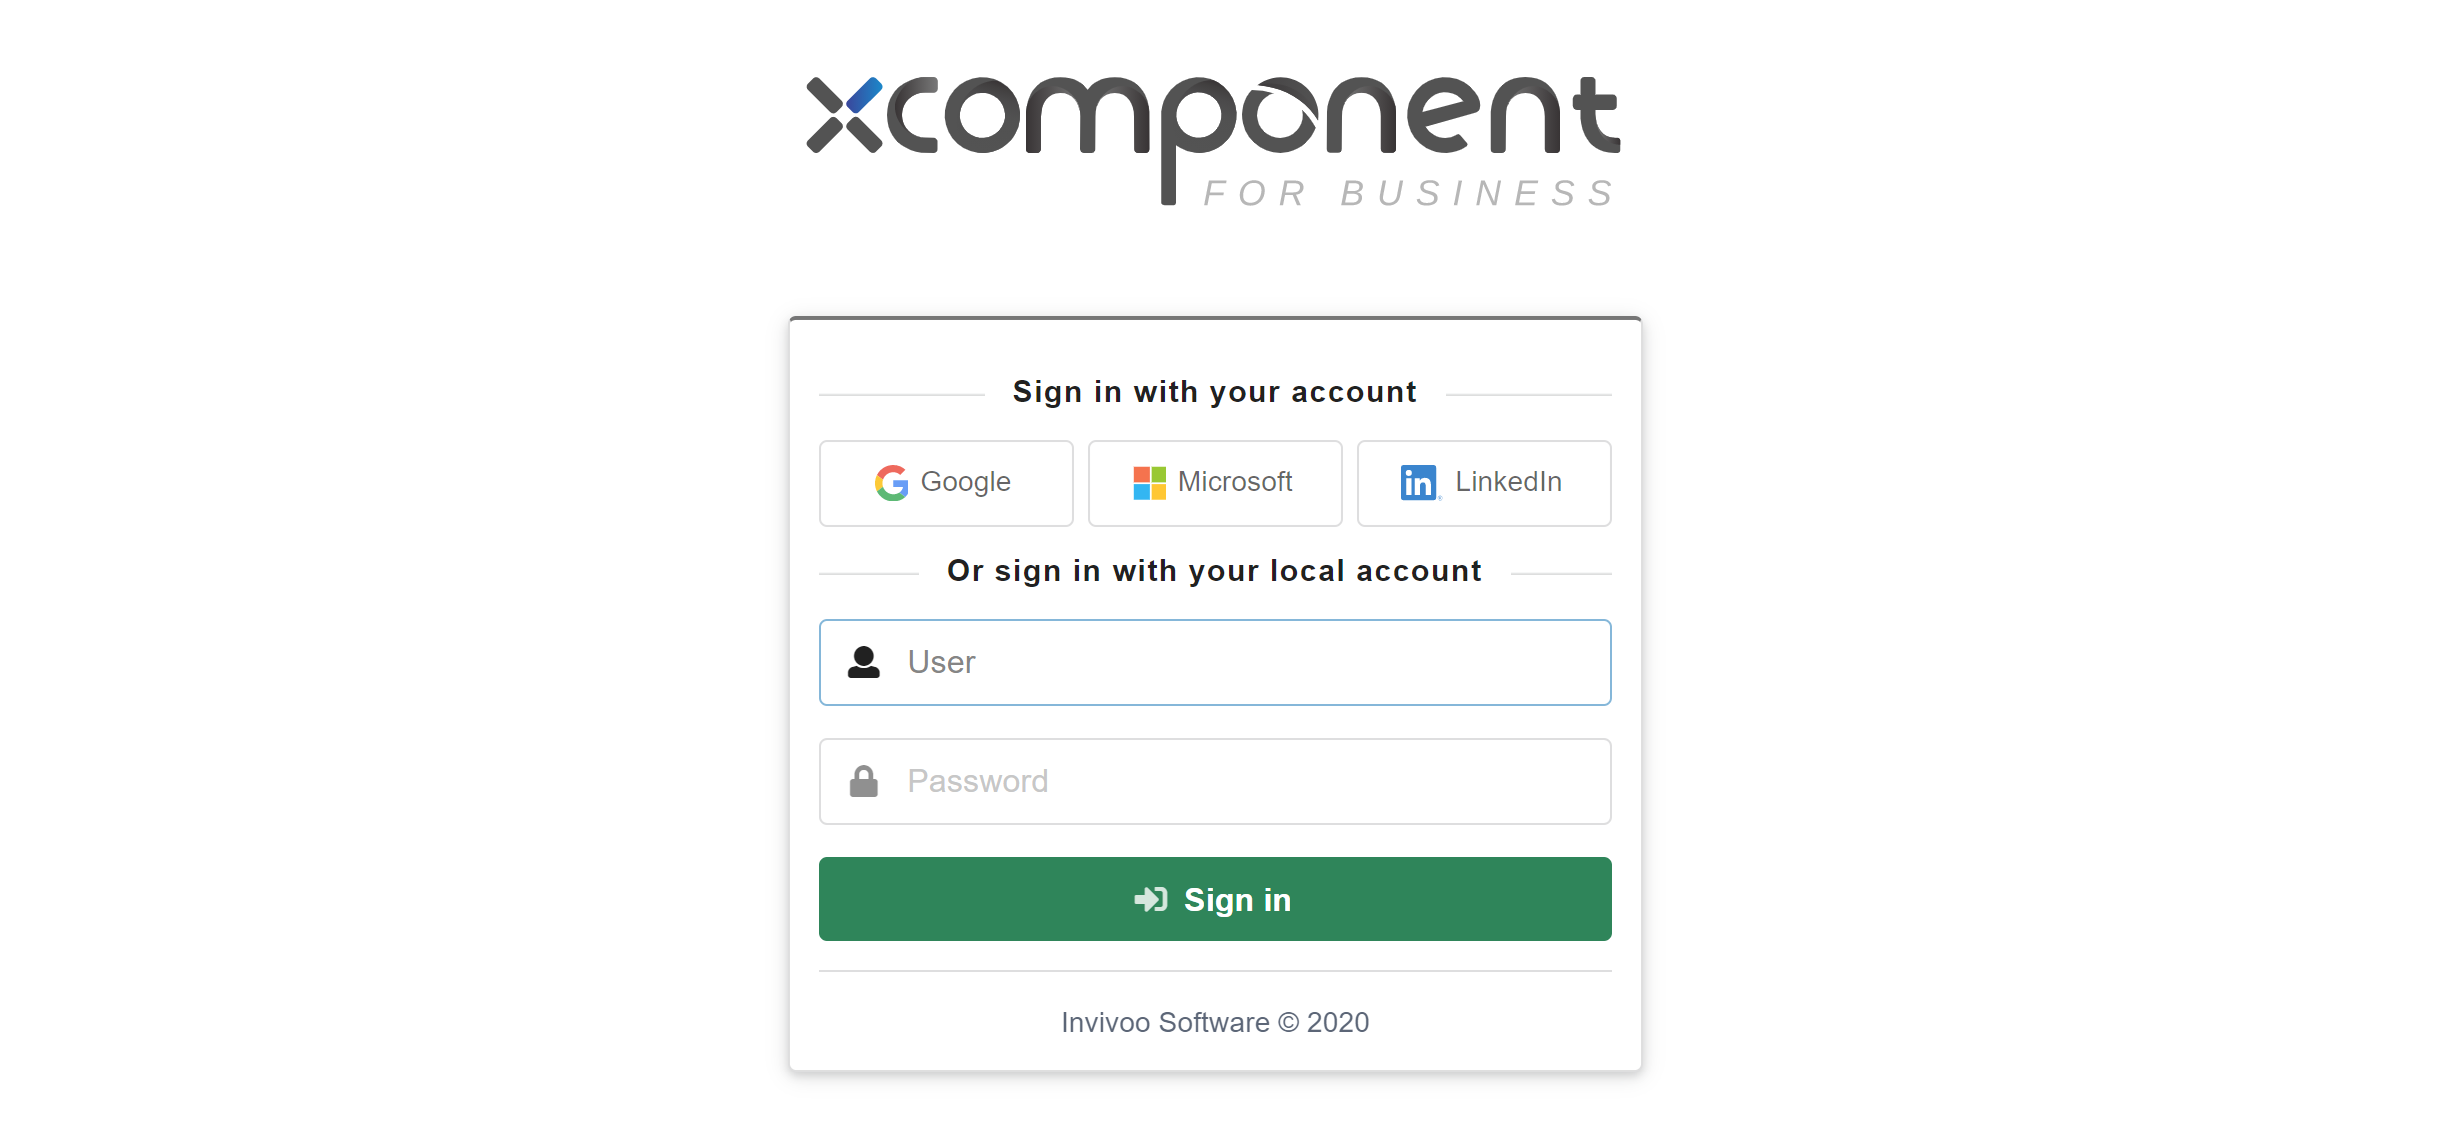
Two modes are available to log in to an account. You can either use a social provider, or enter the user’s credentials to connect with a local account:
-
If you have an account with a social provider and wish to use that identity to log into Scenario, press the button for your provider. Currently Google, Microsoft, and LinkedIn are supported.
-
Entering user credentials is the suitable option if you have a local Scenario account. It’s an account stored in Scenario database. Simply type your credentials and click on the Sign In button.
Scenarios
List of scenarios
After logging into Scenario, the user is presented with the following screen :
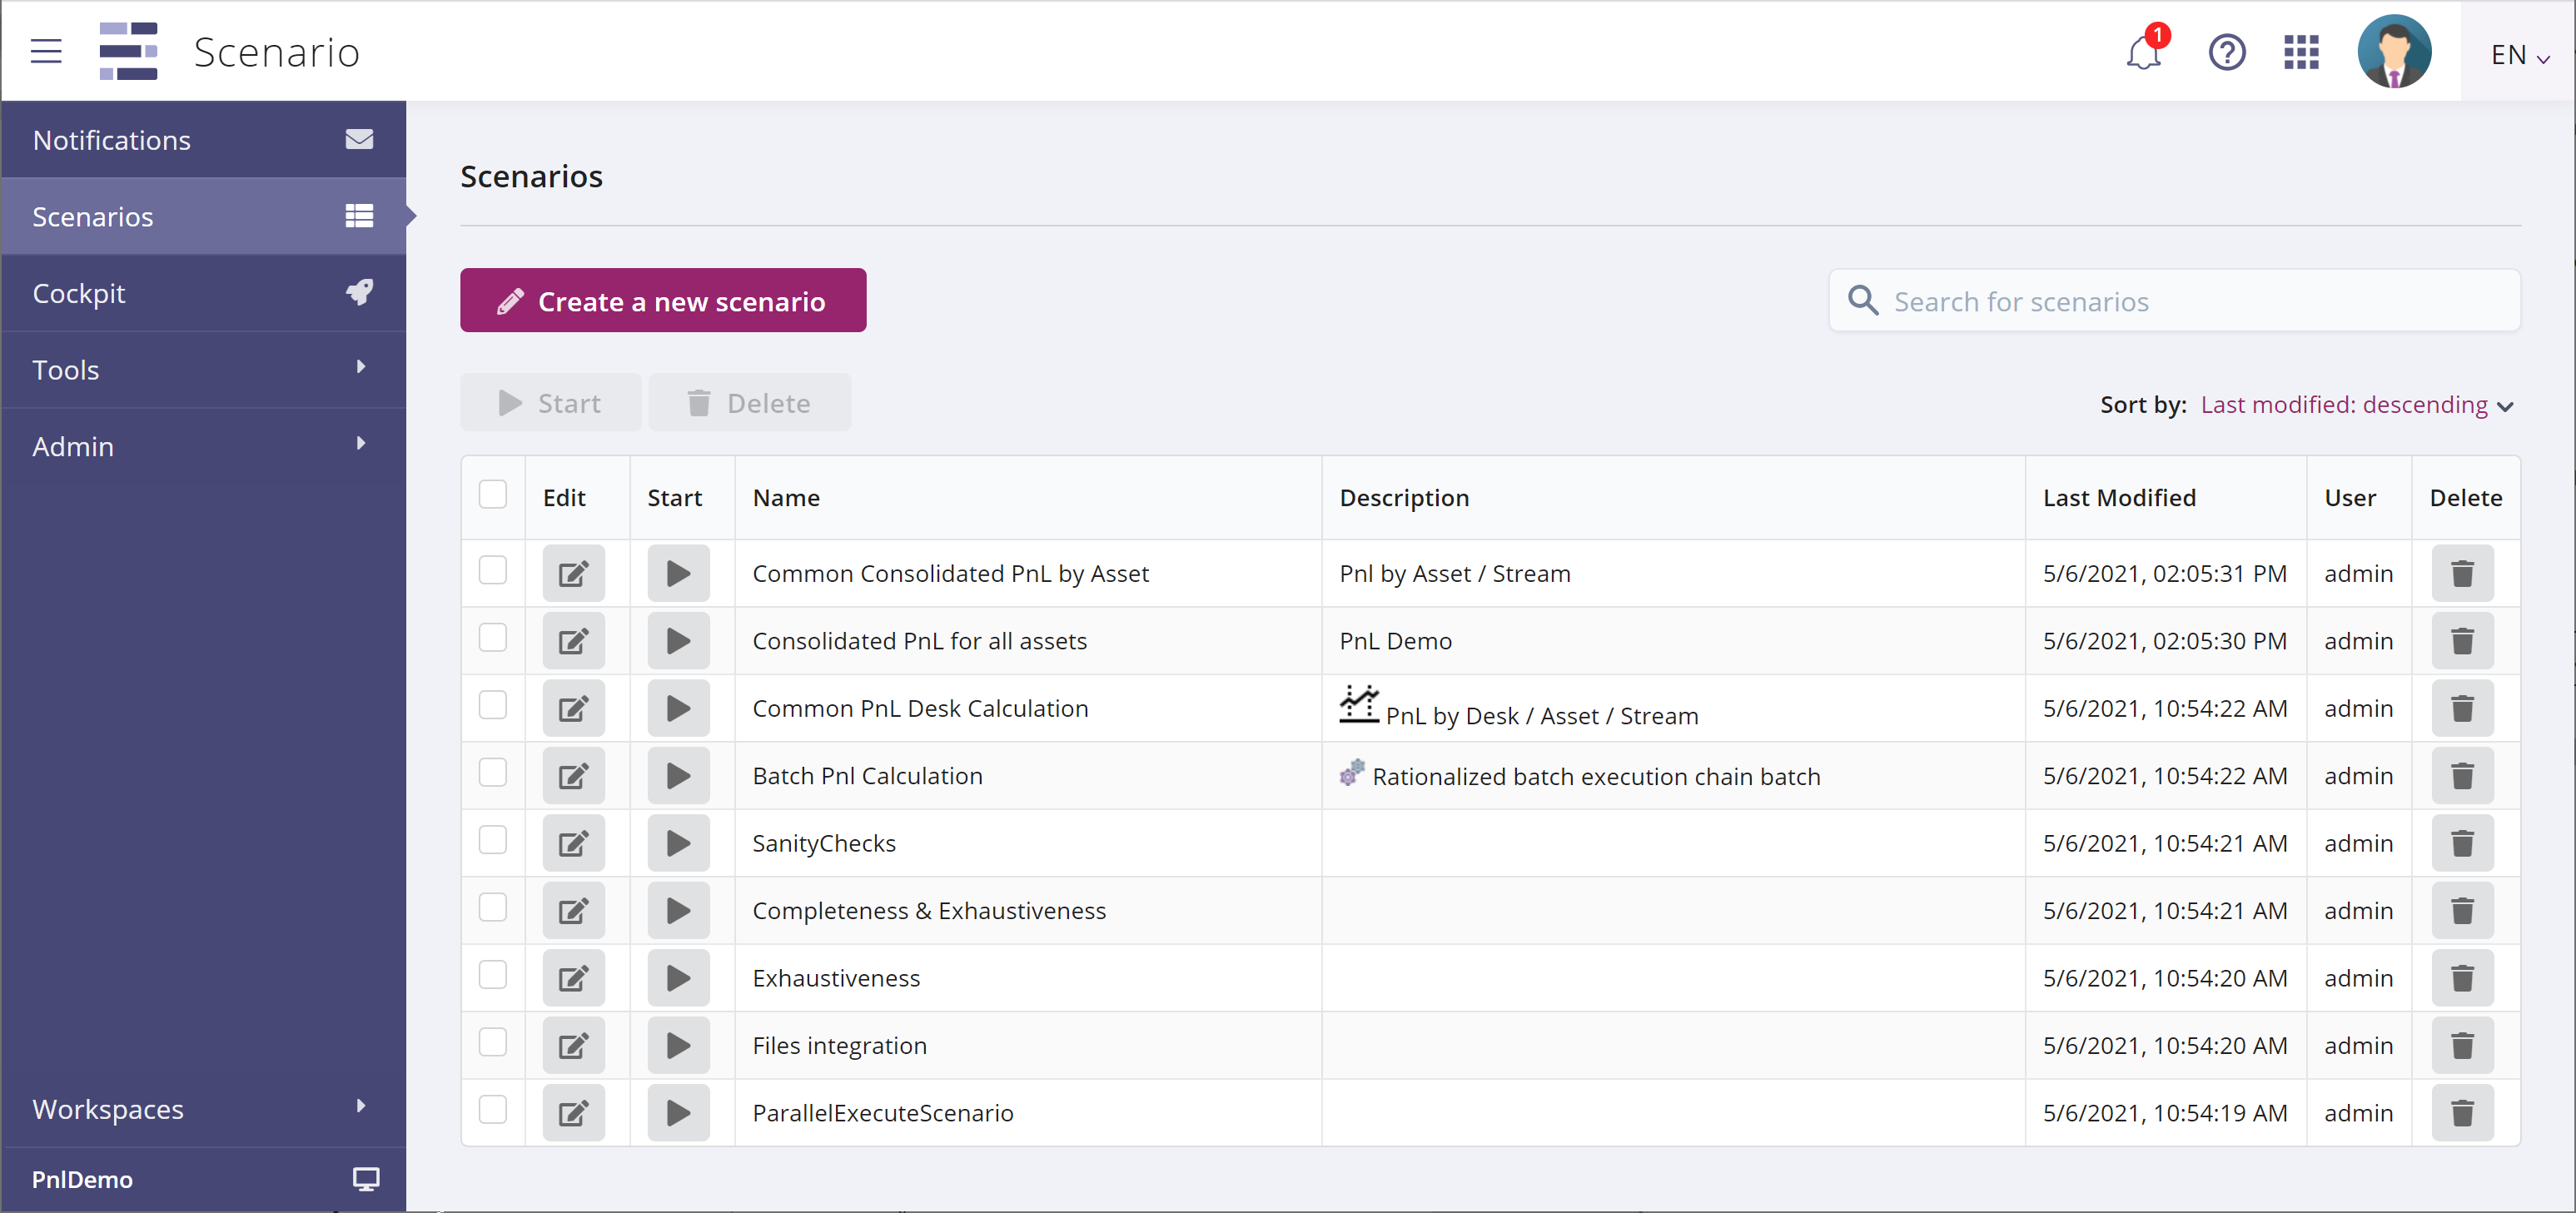
On the left_hand side of the window, a menu panel gives access to the various screens, and other application functionality, as described in Main sections above. On login, the Scenarios page is the current one.
The Create a new scenario button lets you create a new scenario definition, as detailed in Scenario creation page below.
The Search text entry box lets you search for a given scenario in the set of all existing scenarios.
The main body of the page shows a list of scenario definitions, where each row describes one scenario, with several columns either displaying information, or holding some buttons to act on the scenario. Here are the details for each column:
| Column | Icon | Description |
|---|---|---|
| Edit | Edit a scenario definition | |
| Start | Launch a scenario execution | |
| Name | Scenario name | |
| Description | A brief, one-line description of the scenario | |
| Last Modified | Time of last modification | |
| User | Name of the user who created the scenario definition | |
| Delete | Launch a scenario execution |
Scenario creation page
This page is where the design of scenarios takes place. A set of graphical commands lets the user build the graphs that organize the tasks to be executed in each scenario, and a tool panel on the right allows parameters, inputs and outputs to be defined, and also gives access to the task catalog.
Overview
This image explains the various components of the scenario design page, as seen when a scenario is first created:
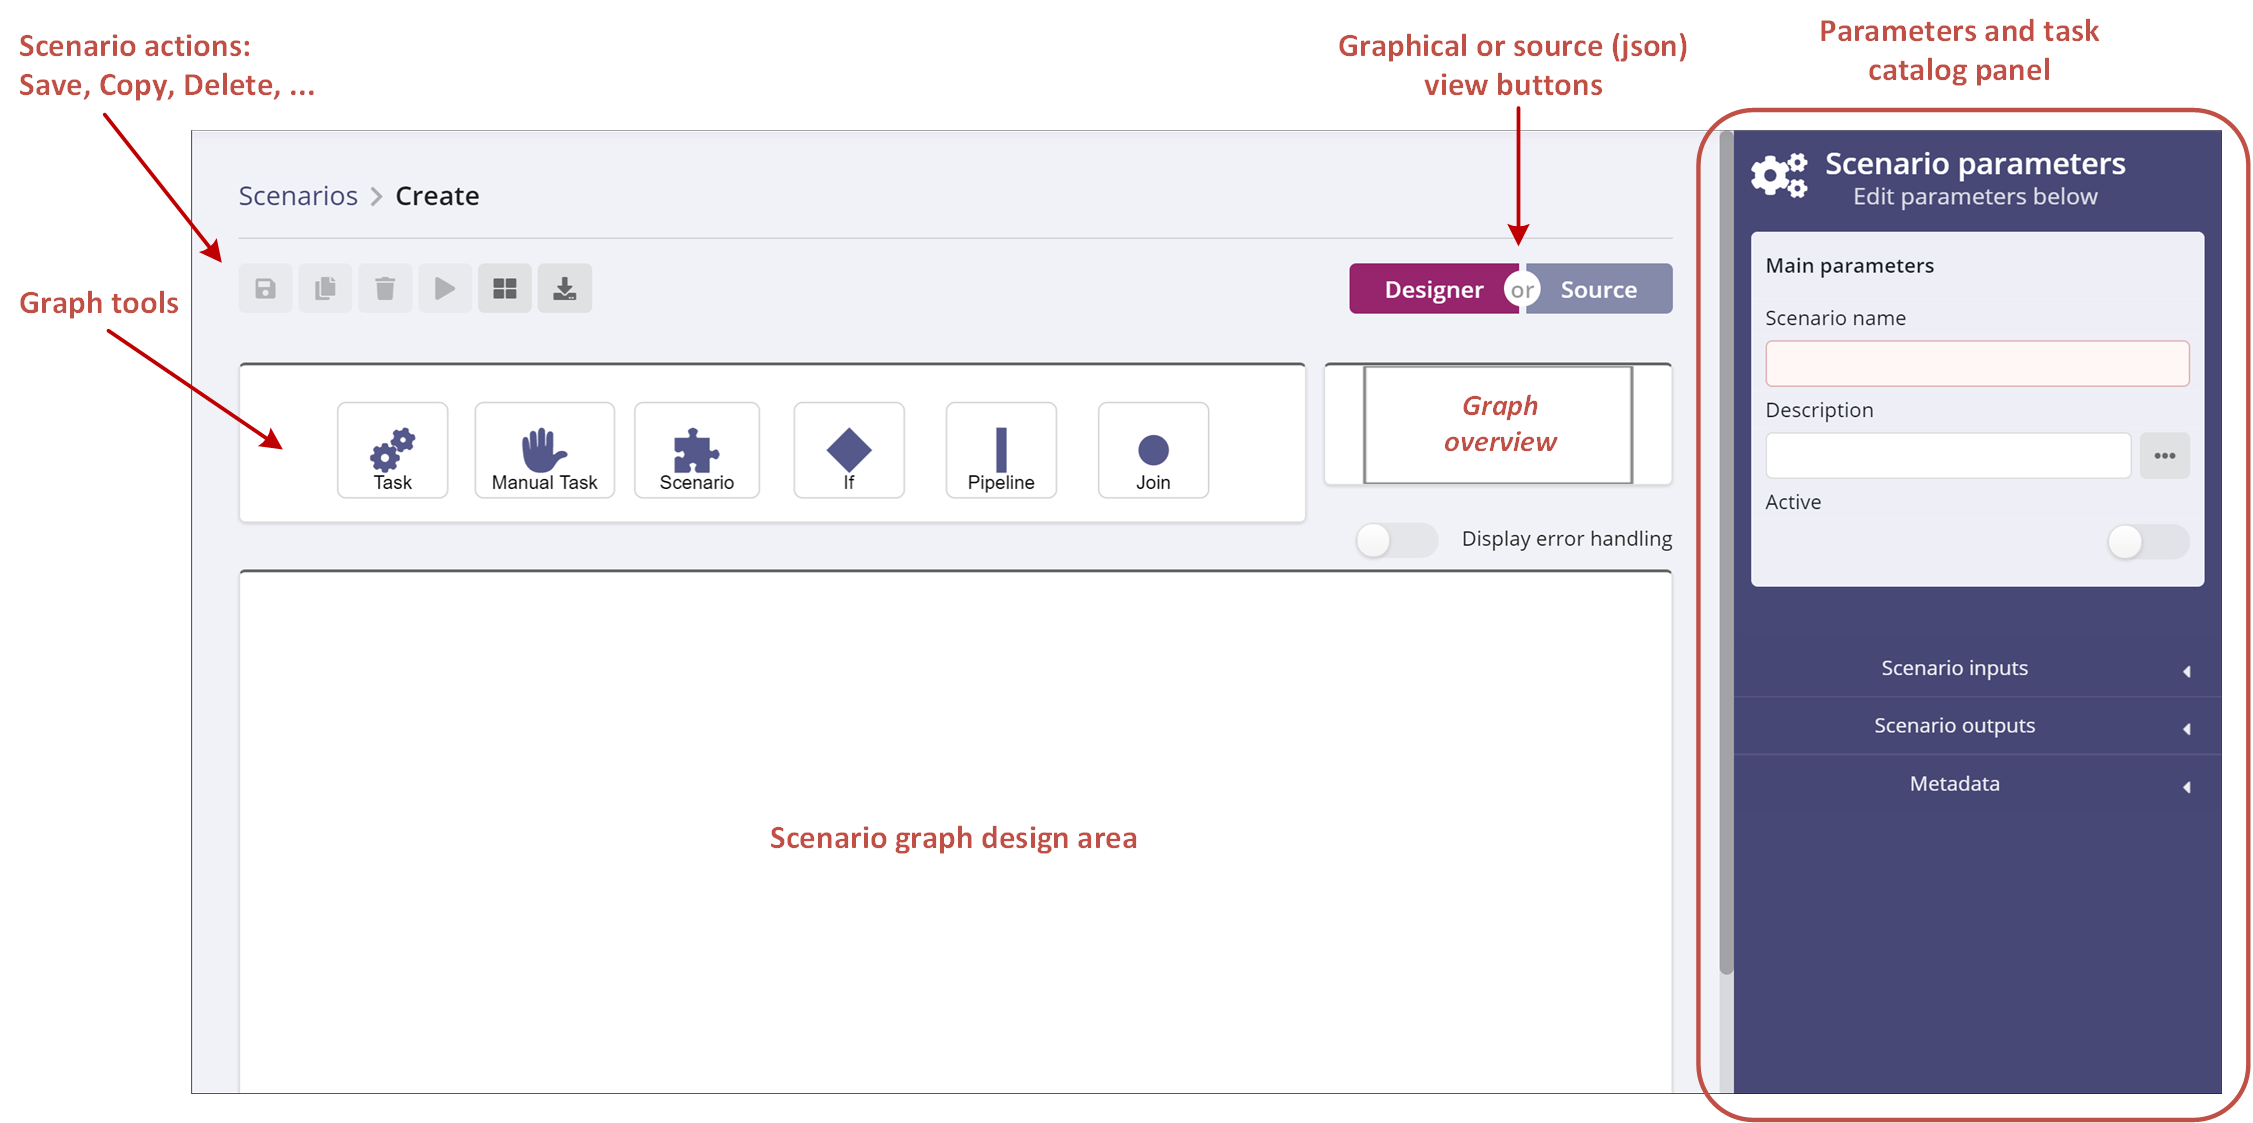
The larger white area is where the scenario graph will be displayed and edited. The graph is created by dragging and dropping icons from the graph tools toolbox. As it grows, and it no longer fits in the window, the graph overview will let the user navigate the entire graph, and change the subset that is displayed.
The scenario action buttons act on the entire scenario : save it, make a copy, delete, cancel current edits, launch an execution run.
The graph or source view buttons give the user access to the underlying JSON representation of a scenario, with the possibility of creating a scenario by dragging a file onto this window.
At any given moment, this screen is in one of two states : scenario-level, or task level, and the panel on the right switches to display the relevant fields. Initially, the page is in scenario mode; clicking on a task switches to task mode; clicking on the white background switches back to scenario mode.
Scenario-level input parameters
When in scenario mode, the panel on the right displays the following scenario-level parameters and controls :
| Panel | Description |
|---|---|
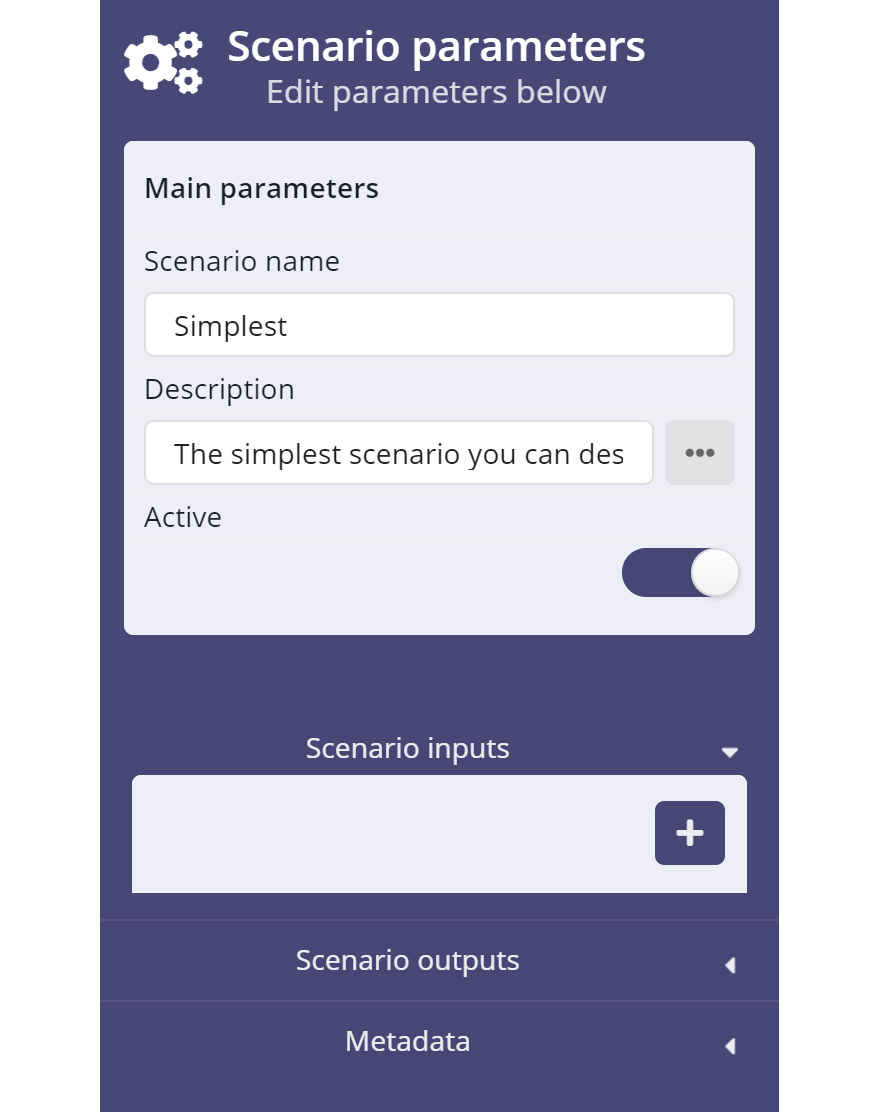 |
Scenario name: a short text identifying the scenario Description: A one-line description of the scenario, that will be used in the list of scenarios (see List of scenarios above). Active button: this button controls whether the scenario can be started or not, only scenarios marked on can be started. Initially, the button is off when a new scenario is created. A future version may require a specific right to turn a draft scenario into a live one. Scenario inputs: press the blue ‘+’ button to add inputs to the scenario. The user will be prompted for these inputs when the scenario is started. Scenario inputs are detailed in the next section. Metadata: information about the scenario itself, such as date and user of scenario creation and modification, and scenario version number. |
Specifying scenario inputs
Scenarios can have inputs defined for them, so that a user can specify a set of parameters for each scenario run. The values entered at run time remain constant for the entire duration of the run. Scenario lets you connect scenario inputs to task inputs (described in Linking to scenario parameters below), so that the user’s parameters can flow down to the level of each individual task.
| Panel | Description |
|---|---|
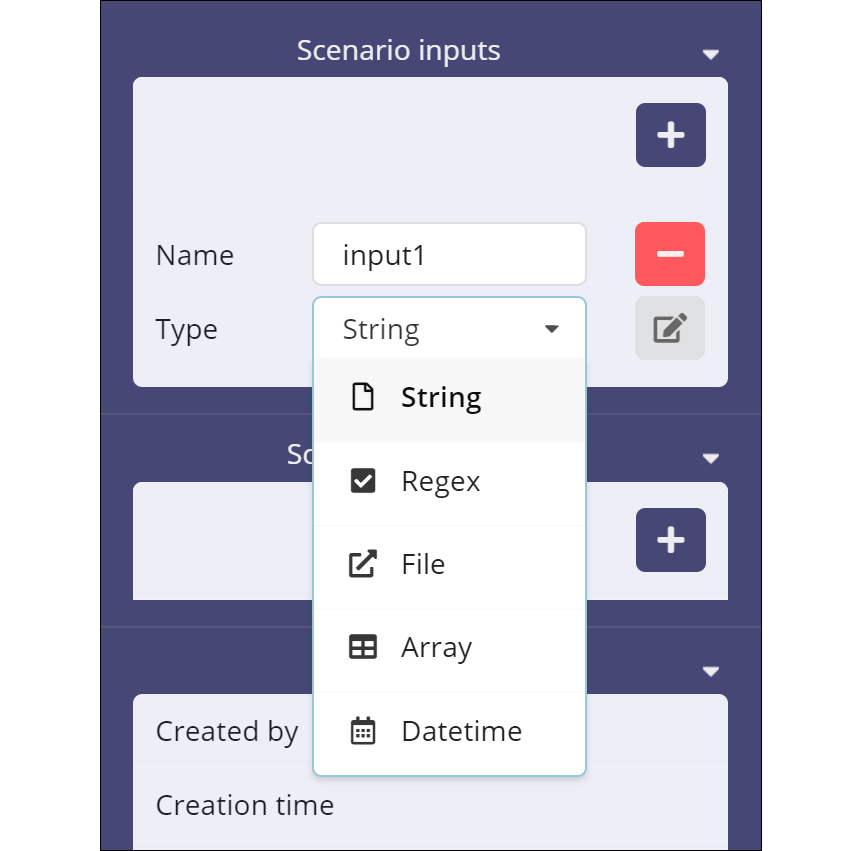 |
Press the blue ‘+’ button to start specifying inputs for the scenario. Scenario displays two text boxes labelled Name and Type. Clicking inside the Type box opens a dropdown menu from which you can pick your type: String: simple free-form value, with an eventual default value Regex: string value constrained by a regular expression File: Scenario will prompt for it at run time (there is no possible default value). Array: TBC. Datetime: TBC. |
The edit button ![]() lets the user enter a default
value, for string inputs, or the regular expression and default value to
be used with regex inputs.
lets the user enter a default
value, for string inputs, or the regular expression and default value to
be used with regex inputs.
Adding tasks to the scenario
You can easily add a task to a scenario by dragging the Task icon into the scenario graph design area, as shown here:

Other icons allow a user to join several tasks in a synchonization tasks. These notions are explained in the Scenario Concepts Guide, and the practical aspects are detailed in the next sections.
When the user clicks on the newly added task, the right-side panel changes from displaying scenario parameters to displaying the following task-level parameters:
| Panel | Description |
|---|---|
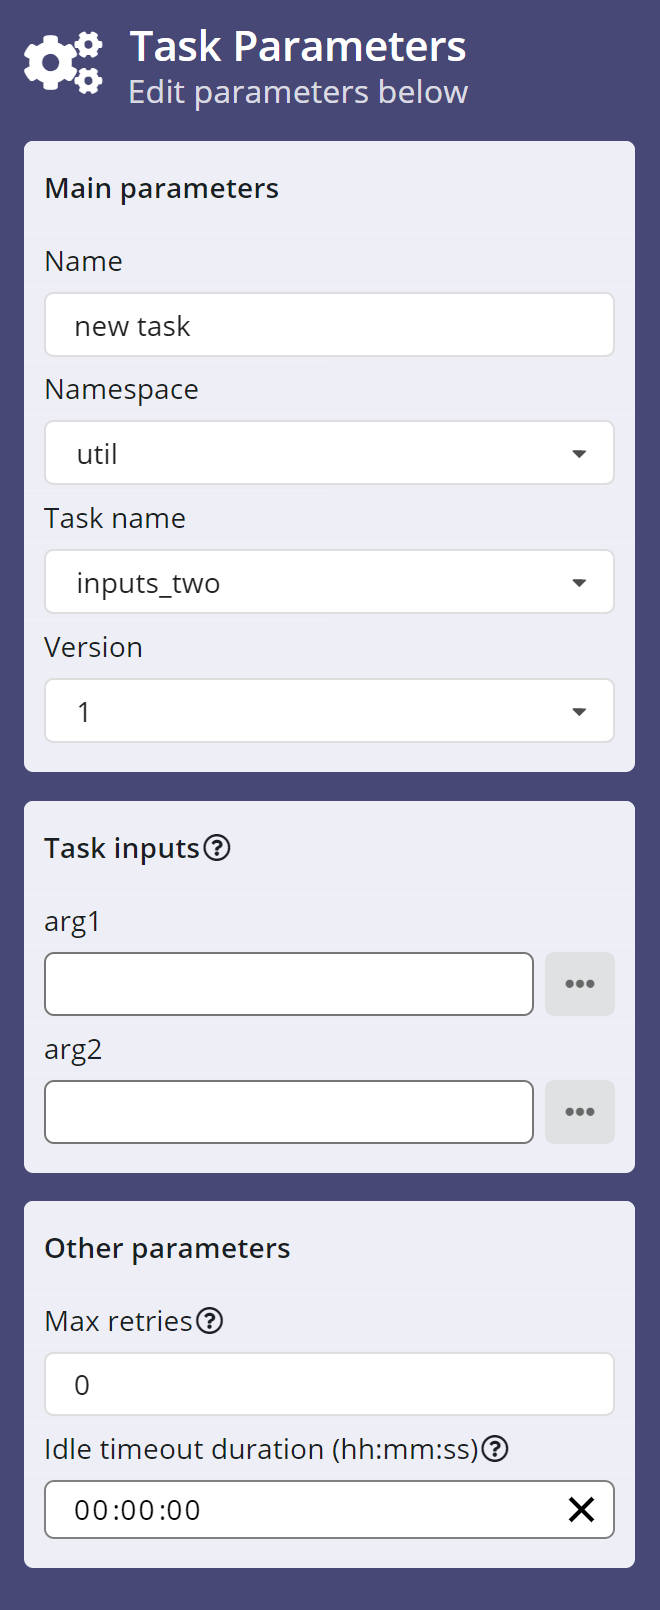 |
Name: A short description of the task, that will be displayed in the task’s icon in the scenario design area. Namespace: a drop-down menu with a list of namespaces. The notion of namespace is central to the functional architecture of Scenario, it groups related tasks into a catalog. Namespaces are explained in greater detail in the Scenario Concepts Guide Task name: this drop-down menu is linked to the previous one. For each namespace set in the previous control, this menu lists all the tasks that are defined as part of that namespace. Collectively these two controls define the catalog of business tasks that are available to the user for the designing of scenarios. Version: Tasks are versioned, and the user can use this drop-down list to choose a specific version of the task. Task inputs: tasks may have input parameters in their definition. When this is the case, the panel displays a control with the input name, a text box to enter a value, and a button to access other, alternative means to provide a value (see next section). In the example shown here, task inputs_two has two inputs called arg1 and arg2.Max retries: an integer value, that specifies how many times Scenario will re-run a task that ended with an error status. Idle timeout: an amount of time after which Scenario will put the task in error status if it has not been completed. |
Dynamic input values
Overview
In the simplest case, the user enters a value for arg1 or arg2 in the text
box above. The value will appear in the input data, when the task is run,
making it available for the processing that is performed by the task. But it
will be a constant value, used for every run of this scenario. While this may
be sufficient for some needs, in most cases users want dynamic values that can
change with each run.
To specify alternative sources of data for a given input, click the button to
the right labelled  to display the input
parameter editor.
The input parameter editor has a text box where the user may type a string value. More interestingly, it has a drop-down menu to let the user specify a data source, and pinpoint the actual datum to be used. When the user presses the arrow below Insert a variable, a drop-down menu is displayed:
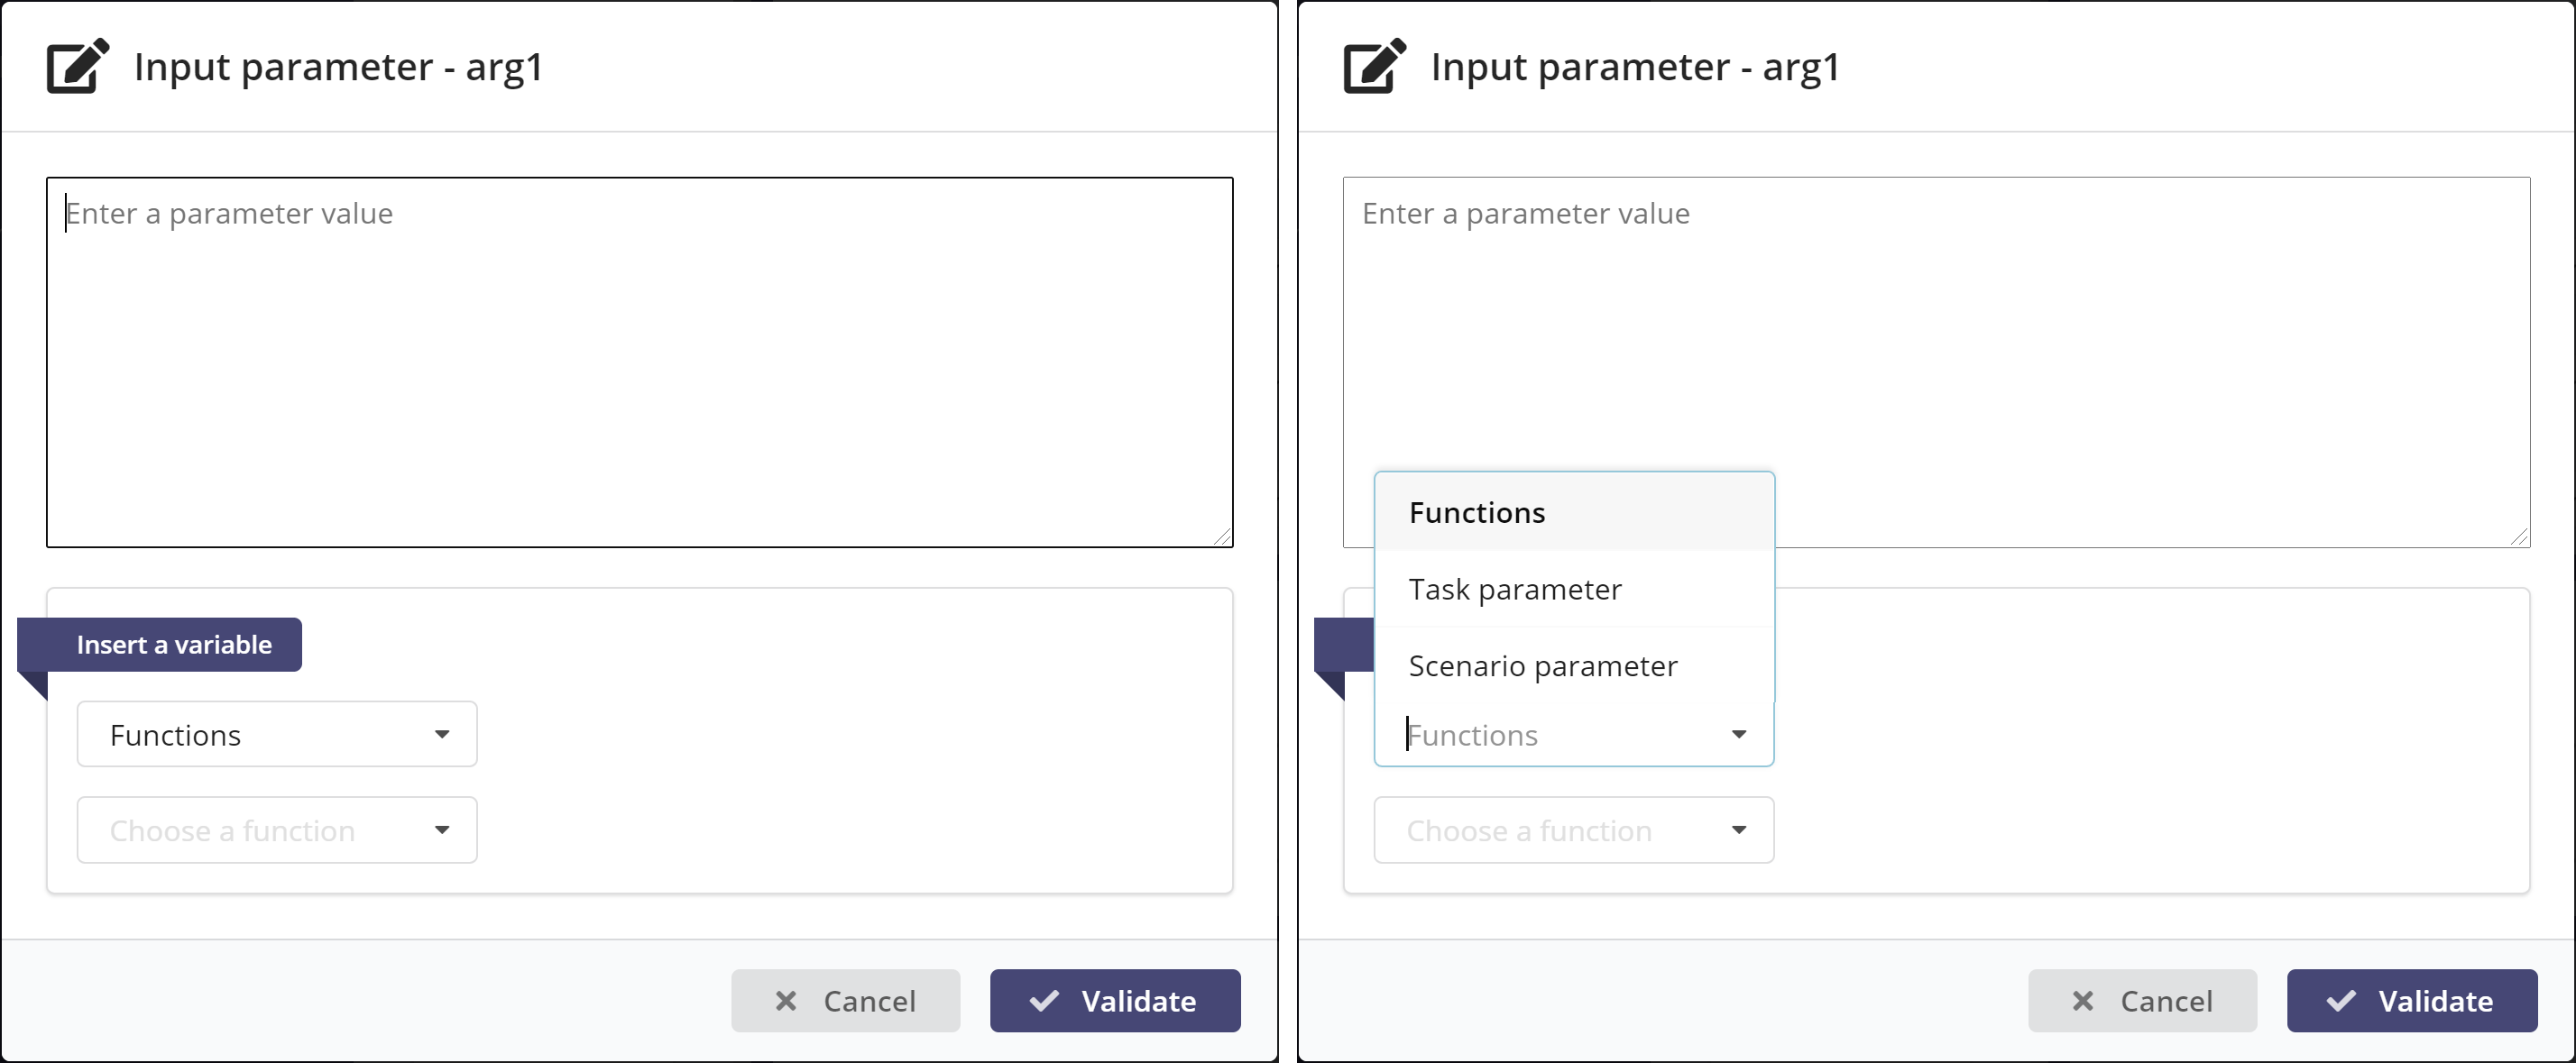
The following data sources are available:
-
Task parameters: use this data source to access input or output parameters of other tasks. This will typically be used to route a calculation result, from an output of the task that calculated it, to an input of a task that needs to use the result in its own processing.
-
Scenario parameters: use this data source to access the input parameters specified for the scenario itself. These values are entered by the user when the scenario is launched, so the values are specific to each run. For example, a scenario may perform a market risk calculation, such as a VaR, for a given day ; the scenario would then have an input parameter called As-of-date, and the calculation tasks would access that value by referring to the as-of parameter from one of their own inputs.
-
Functions: helper functions can be used to let a user build a complex string value, by replacing the specific syntax of function references with the actual value calculated by the function. Currently three functions are available:
- New GUID: generate a Globally Unique ID
- Datetime: replace with the current date
- Scenario Base Url: the base URL for this Scenario server
Linking to task parameters
Selecting the Task parameter item will display the list of tasks currently defined in the scenario. Assuming the user has created two tasks called A and B (see Adding tasks to the scenario), this is what will be displayed:

For any given task, the inputs or outputs may be specified as the desired source. If we pick the outputData, we are presented with the list of outputs of this task, in this case a field called msg:

When the user selects the field, Scenario generates an expression between square brackets that identifies the source of the data that will be fed into this input value. This is also called templating, and is explained with the following image:

(Black font represents constant parts of the expression, blue font is used for variable parts)
Linking to scenario parameters
Selecting the Scenario parameter item will display the list of input data
fields defined for the scenario. Assuming the user has created two
scenario-level inputs called nbr_records and text
(see Scenario-level input parameters), this
is what will be displayed:

When the user clicks the ![]() button, Scenario
generates a templating expression that identifies the source of the data that
will be fed into this input value:
button, Scenario
generates a templating expression that identifies the source of the data that
will be fed into this input value:

Cockpit
The Cockpit page is where you can follow the Scenario activity in real-time, checking the entire set running of currently running scenarios, zooming in to a specific scenario, or even to a specific task.
Toplevel view
When you first click on the Cockpit button in the page header, Scenario presents the toplevel view, which lists the current history in terms of scenario instances, both running and terminated. In the image below, you can see that there are six scenario instances running; there are also a number of instances that have finished their run, either normally or in error.
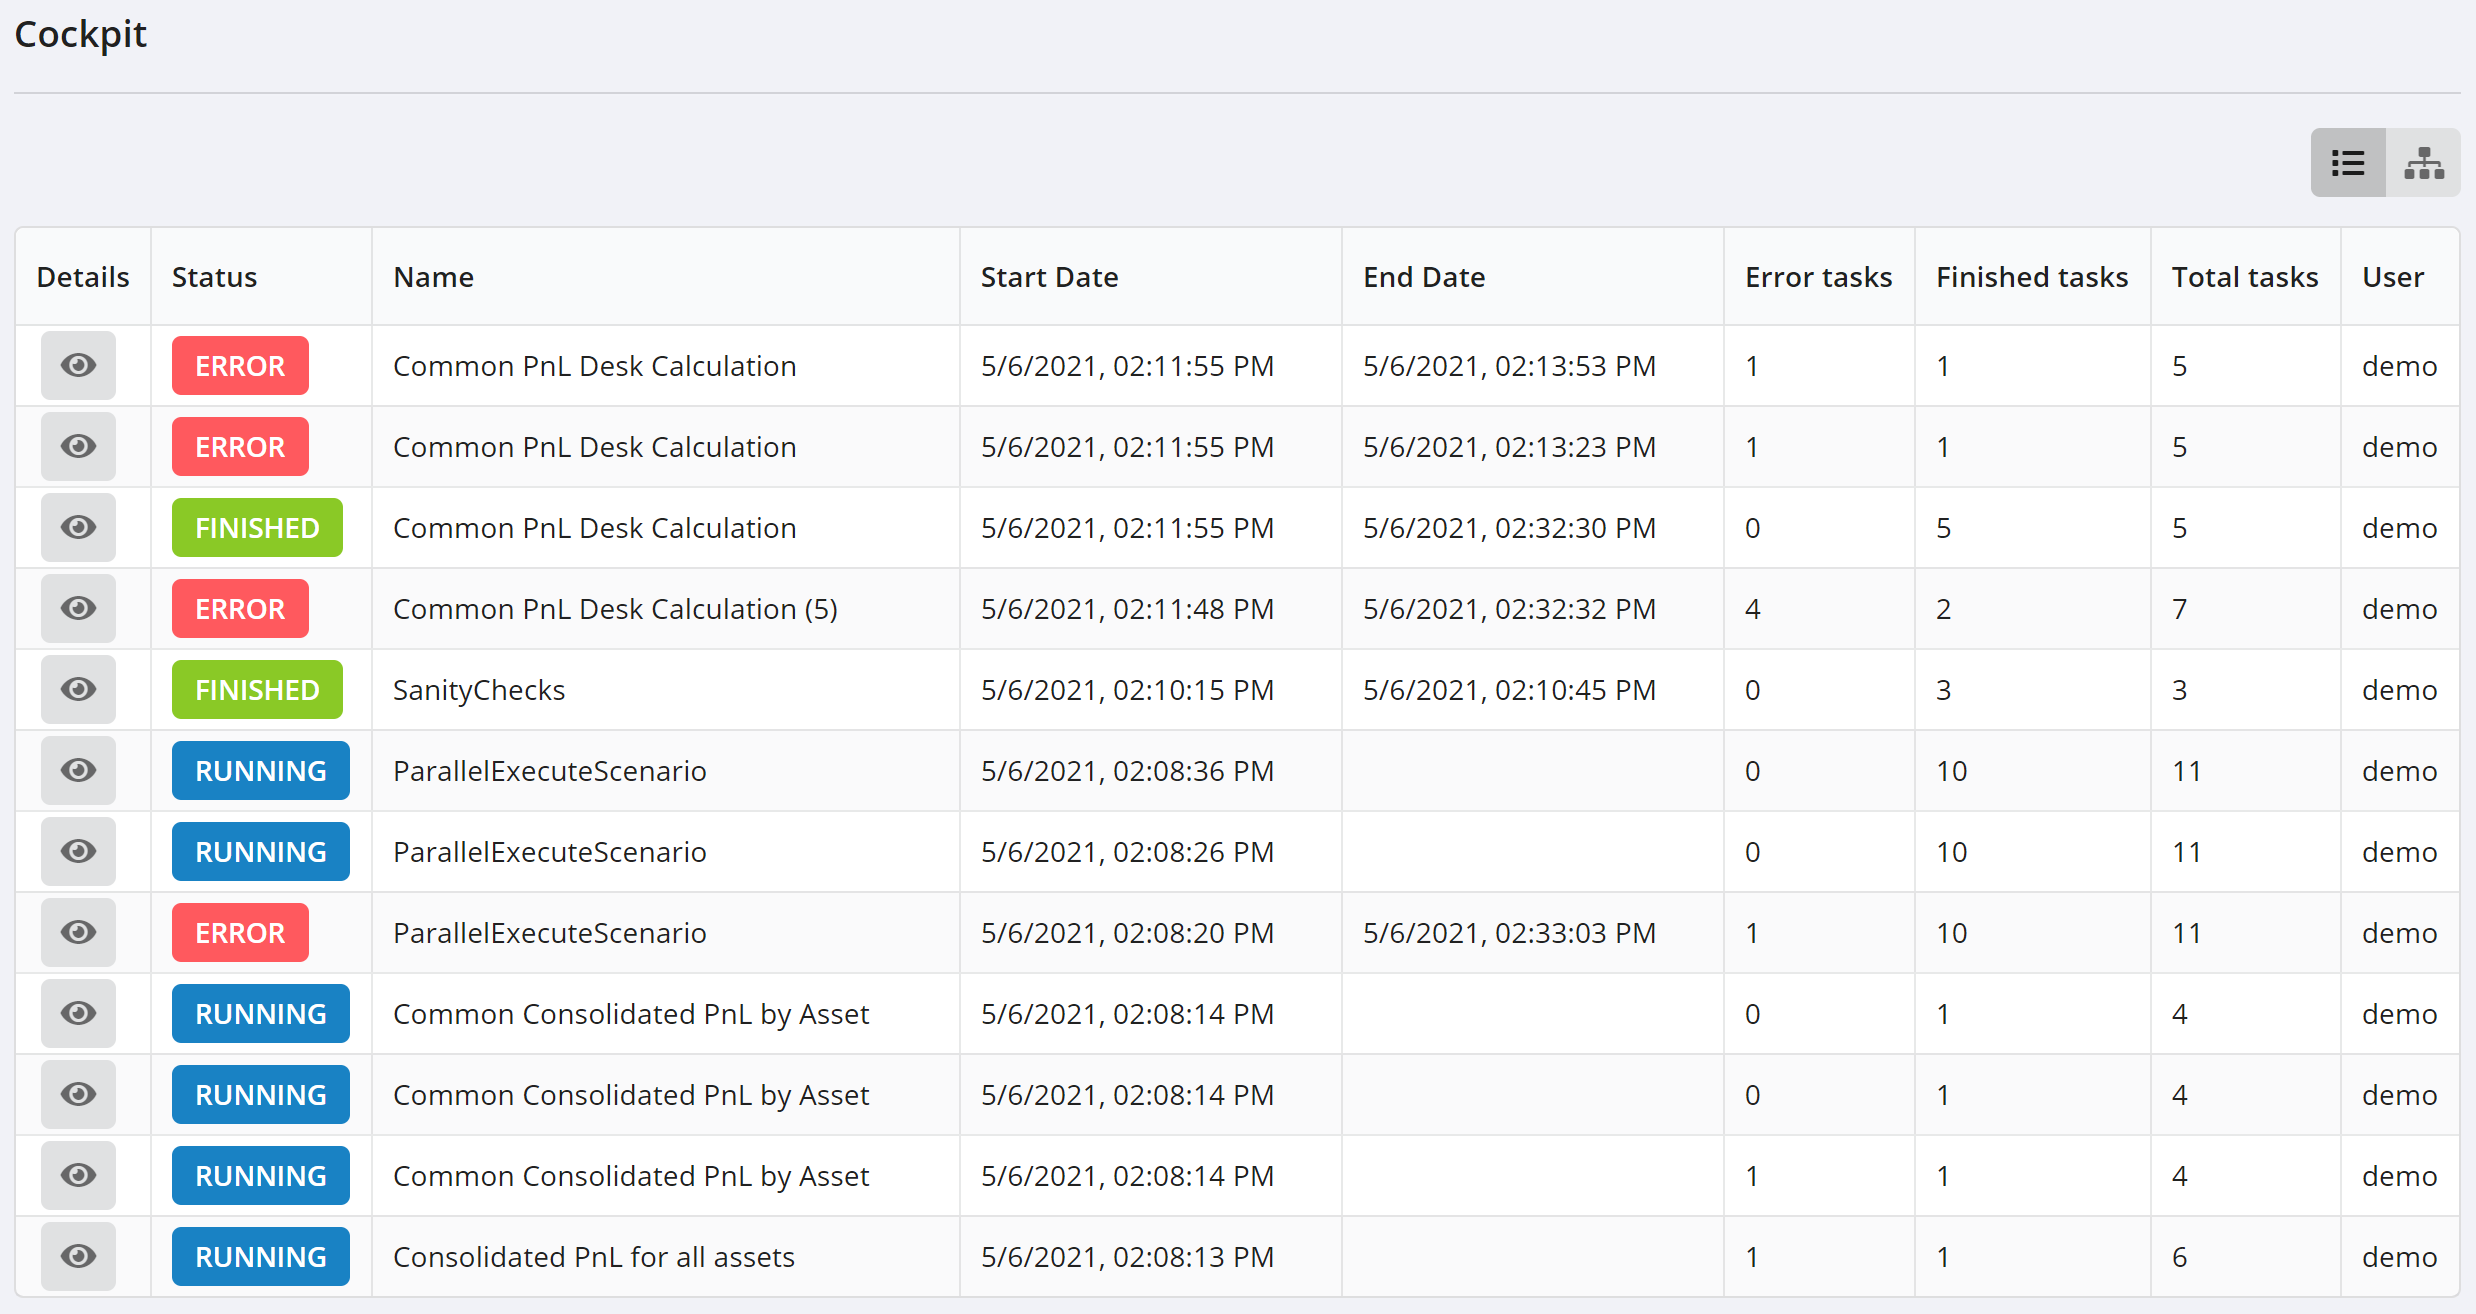
The main body of the page shows a list of scenario instances, where each row describes one scenario instance, with several columns displaying information about the instance. Here are the details for each column:
| Column | Description |
|---|---|
| Details | Zoom into the scenario description |
| Status | Current status of this scenario run (Running, Finished, Error, etc) |
| Name | Scenario definiton name |
| Start/End Date | Date and time when the scenario instance started (or ended) running |
| Tasks | Statistics on task executions |
| User | The username of the person that started the scenario run |
The ‘eye’ icon ![]() in the Details column lets
you zoom into that scenario for more details, described below.
in the Details column lets
you zoom into that scenario for more details, described below.
Scenario-level view
Clicking on the ‘eye’ icon displays a view of the scenario instance, showing a graphical representation of the scenario definition (as a DAG, directed acyclic graph), as well as information about the current run.
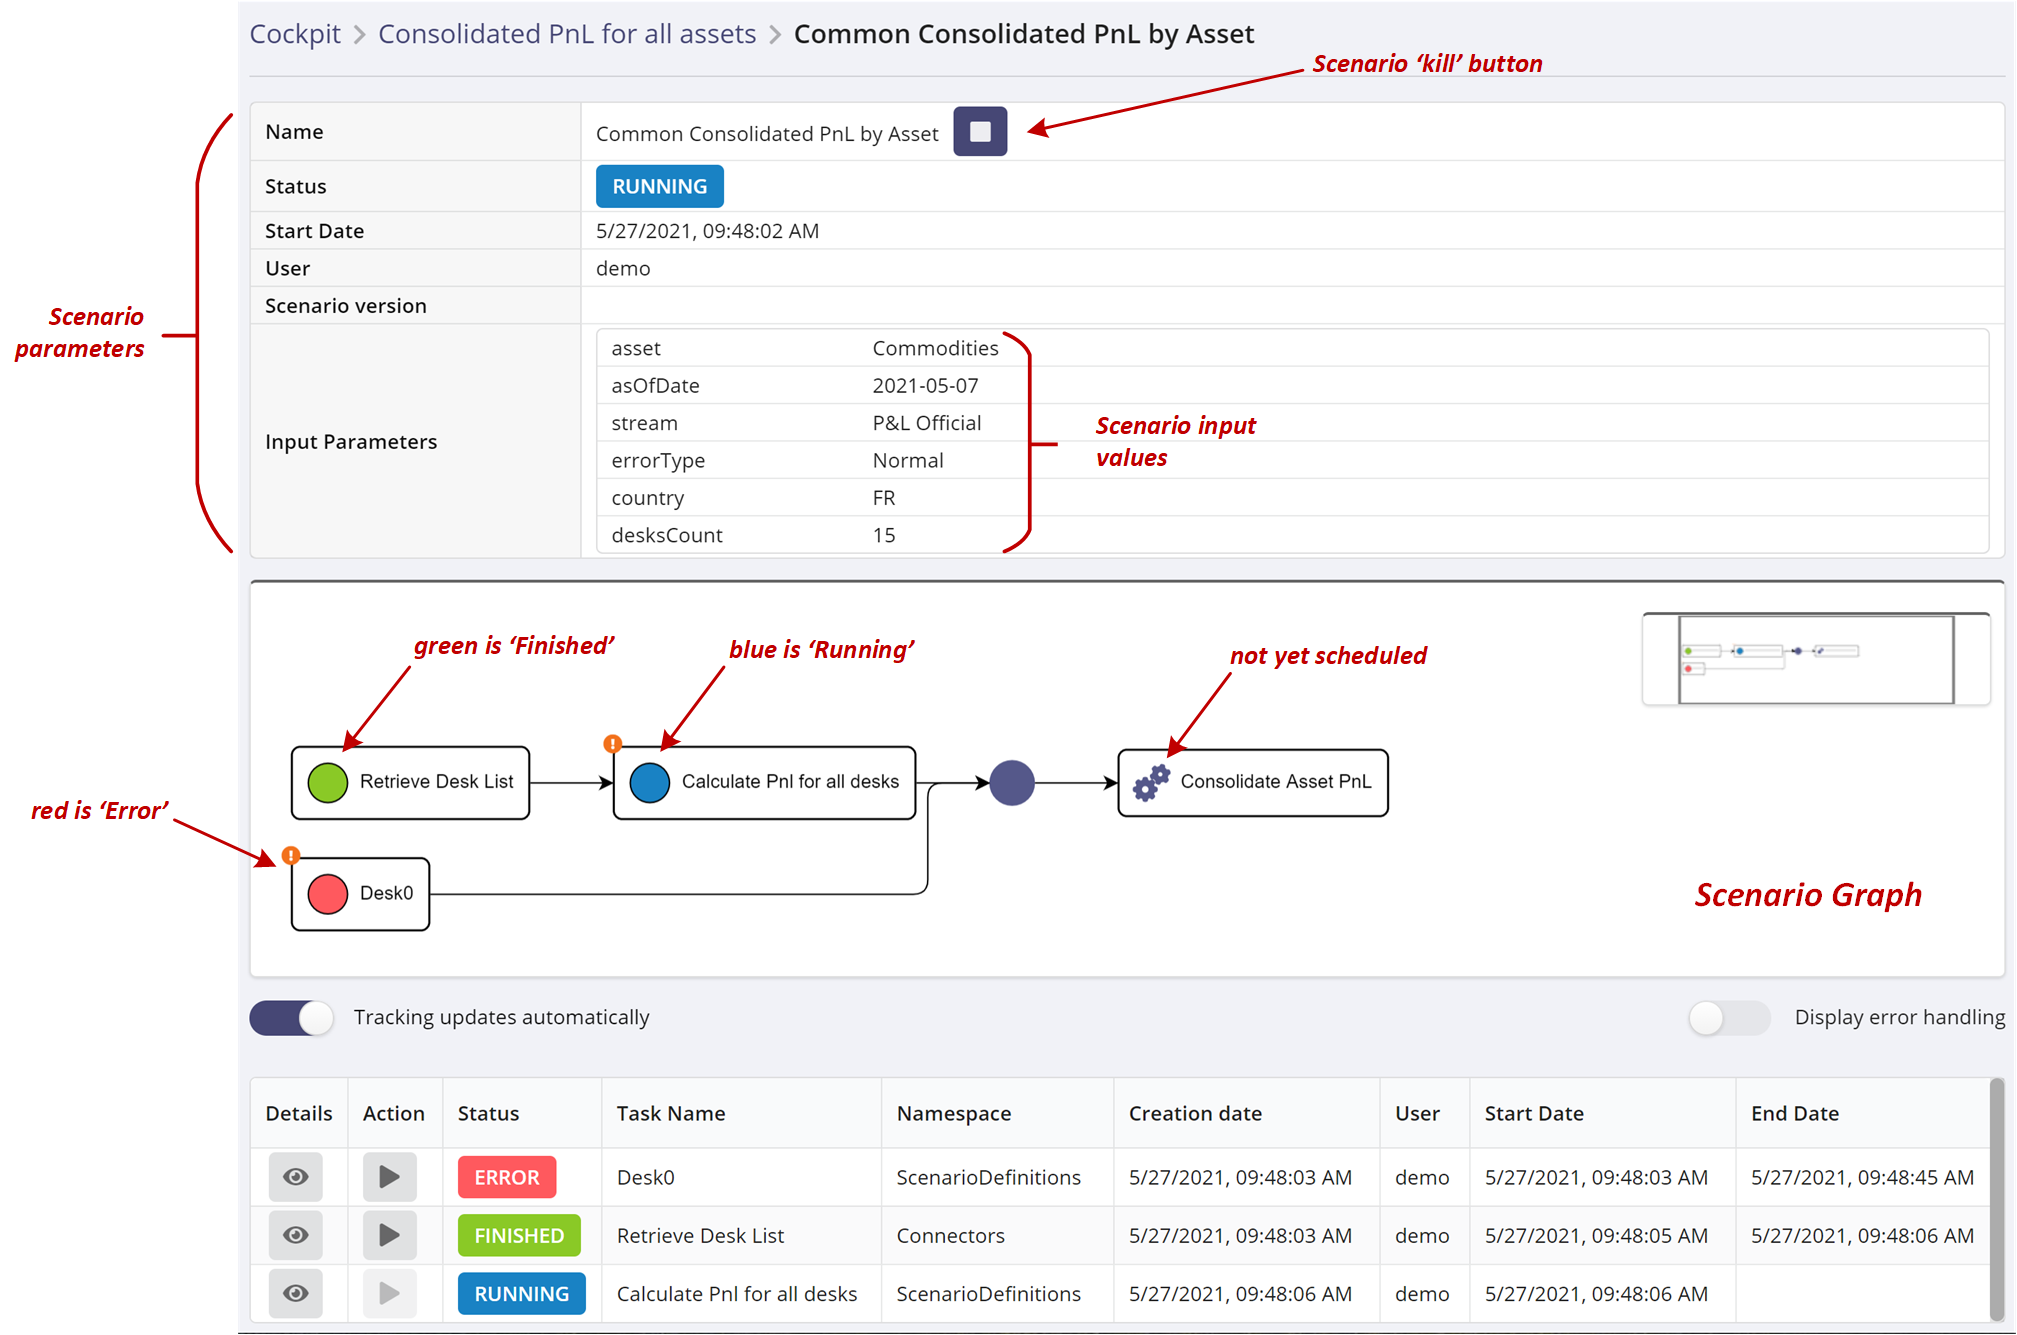
The view has three main parts:
- top tier: shows scenario data, including launch-time parameters with their values, and a scenario kill button to stop the current run.
- middle tier: the dynamic, graphical view of the running scenario. Task are color-coded according to their current status, updated in real-time so it’s easy to see the progression of this run.
- lower tier: an array of tasks, displaying tasks from this scenario that have run or are still running, and updating in real-time. For each task, the following elements are available :
| Column | Description |
|---|---|
| Details | Zoom into the task description |
| Action | Re-run this task |
| Status | Current status of this scenario task (Running, Finished, Error, etc) |
| Task Name | Task name |
| Namespace | The namespace to which this task belongs. See the Concepts Guide for more information |
| Creation Date | Date and time when the task was scheduled by the Scenario engine, i.e. the moment wen it was pushed onto the task queue |
| User | The username of the person that started the scenario run |
| Start Date | Date and time when the task was pulled from the queue by a worker program to be executed |
| End Date | Date and time when the task finished its execution |
Note: the difference between create time and start time indicates how long the task waited on the queue. This delay depends on each worker program’s polling interval, but it can also indicate a throughput problem, if the delay becomes important.
Task-level view
Clicking on the ‘eye’ icon, in one of the rows of the task array, displays a detailed view of the task:
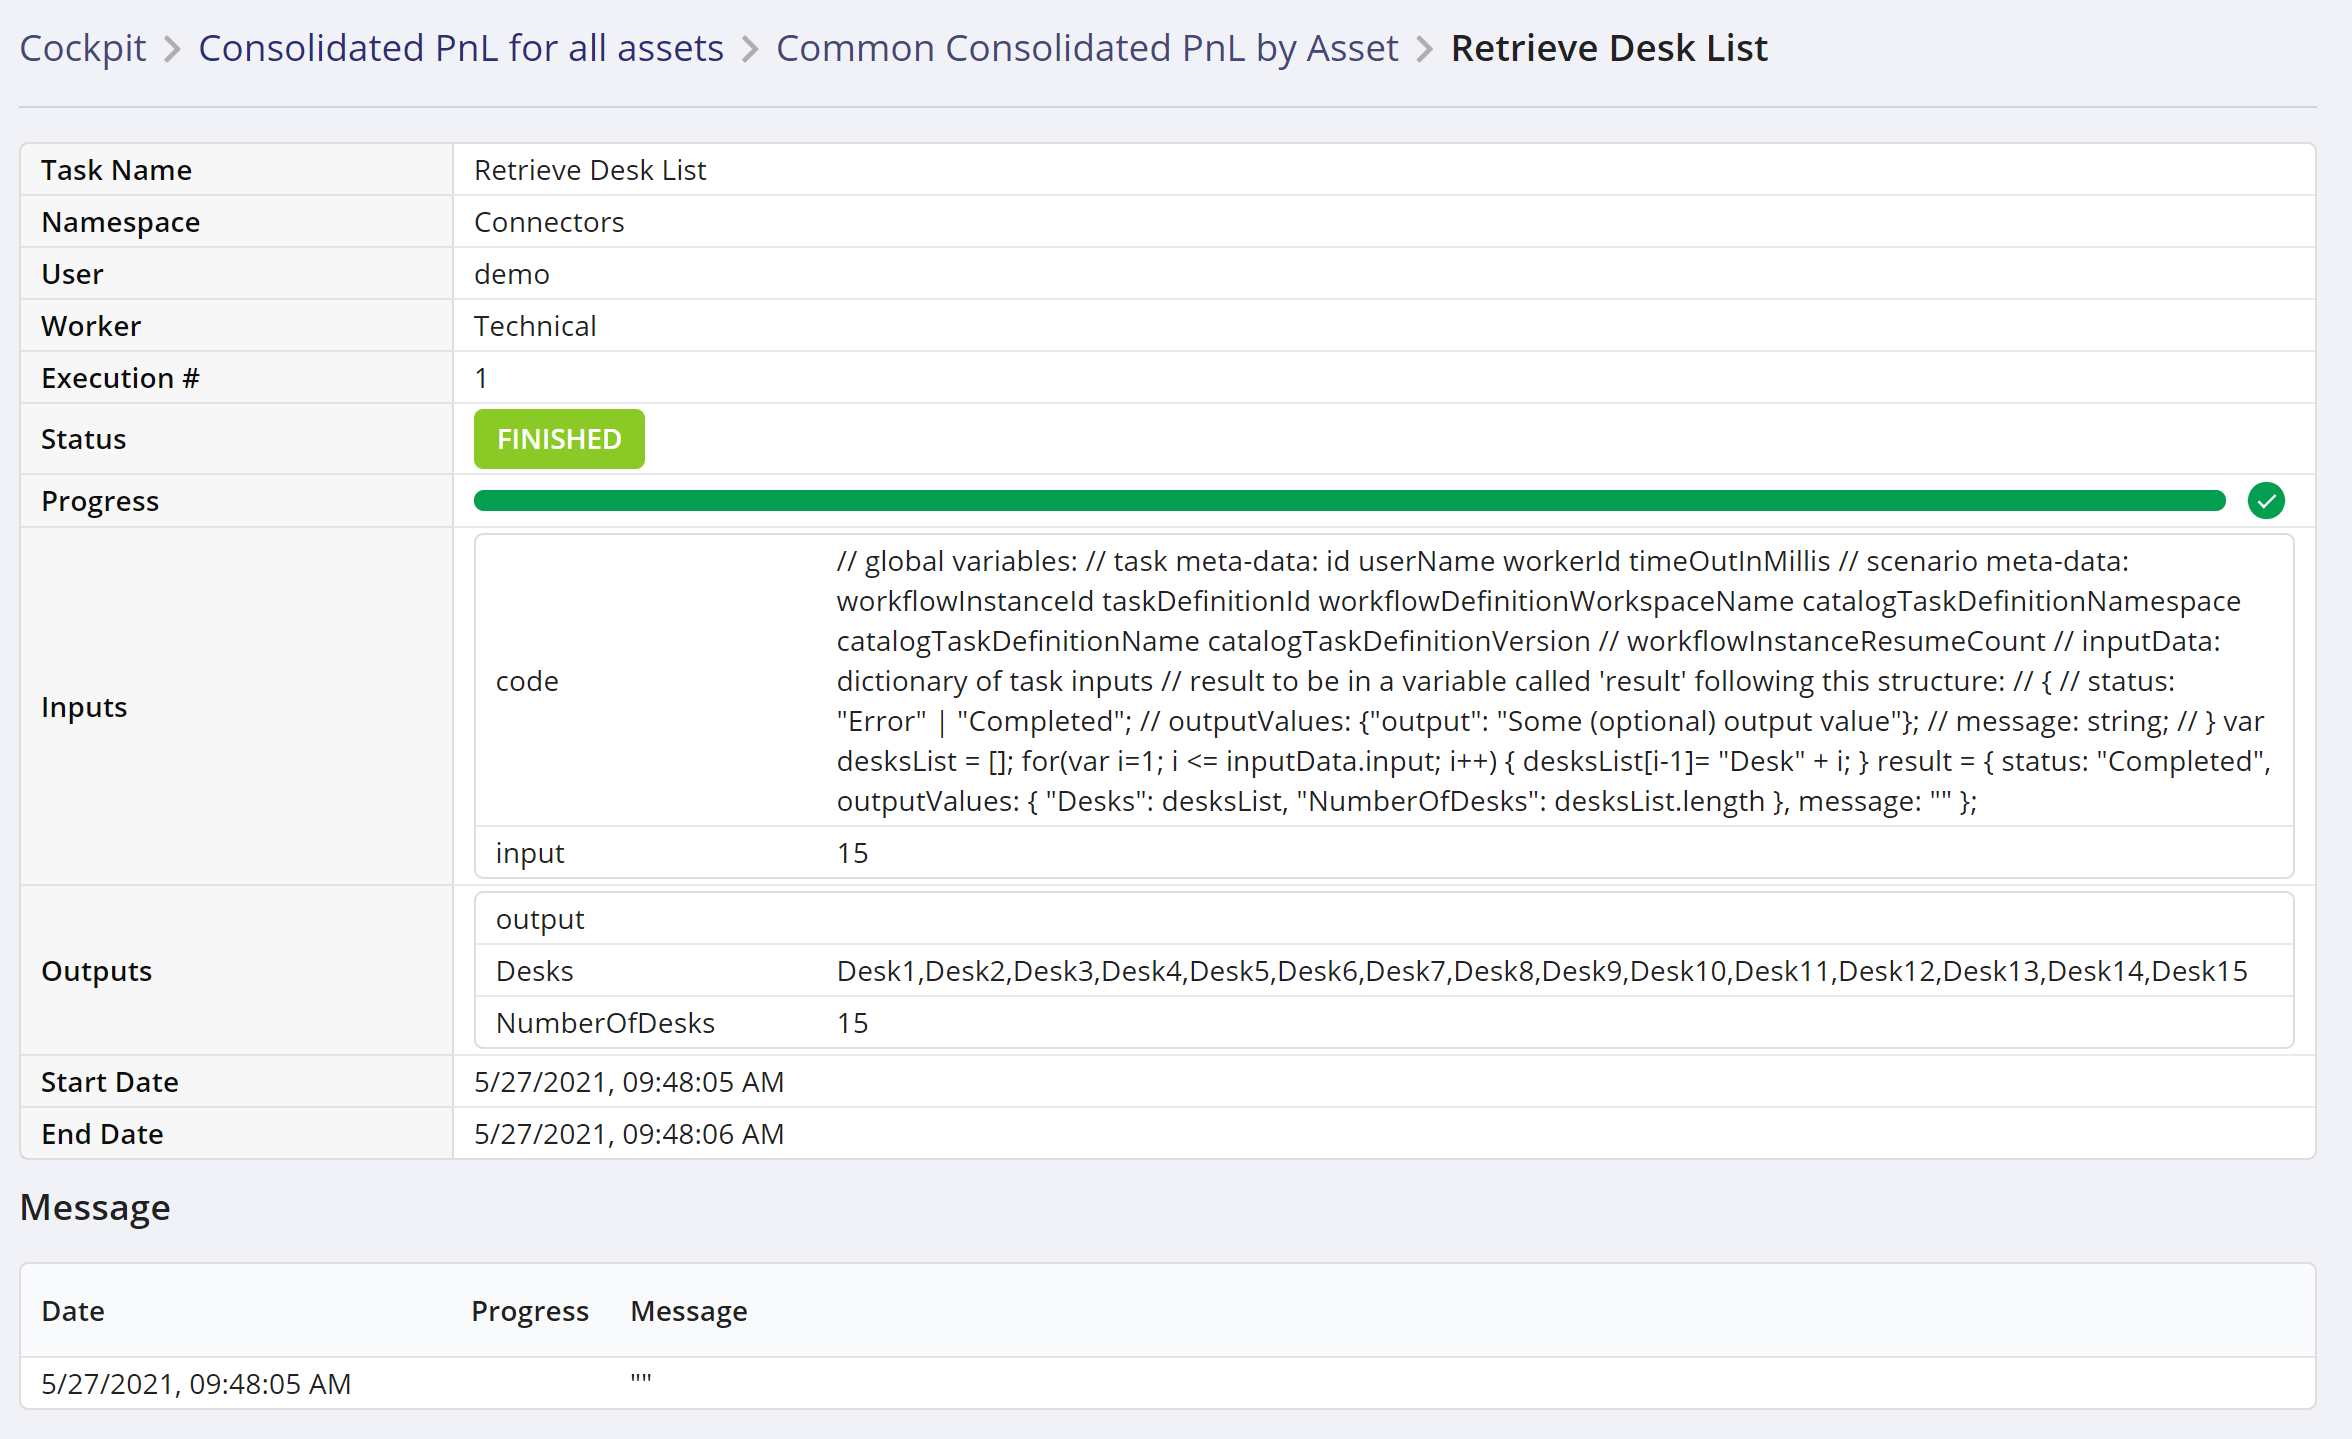
The first part of the view is a table of task attributes (name, worker, status, etc) and task parameters (input/output).
- input parameters may have values or not, depending on the overall status of this scenario run. When a task input is defined as a reference to the output of some other task, a value will be displayed here if the other task has finished its execution, and produced its result. Otherwise this field will be empty.
- output parameters are produced when a task finishes its execution. They are sent by the worker program, to the Scenario engine, in a TaskStatusEvent object, with status Completed (if the task’s execution finished without errors). If a task finishes in an error state, then the output data is not produced.
The second part of the view displays messages sent by the worker program during task execution (with InProgress status, or at the end of its execution (with Completed status).